Climate Change
The year 2007 has seen the publication of the Fourth Assessment Report of the United Nations Intergovernmental Panel on Climate Change (IPCC). The role of the IPPC is to assess the scientific basis of human and natural drivers of climate change (WGI), its potential consequences (WGII) and the possibilities for adaptation and mitigation (WGIII).
The assessments are made largely on the basis of peer reviewed and published scientific literature. They are based on an enormous mass of data from hundreds of studies around the world, and have sometimes been criticised for being too conservative in their wording.
The Report of Working Group I
The Physical Science Basis-Summary for Policymakers, was released on 2nd Feb. 2007 in Paris.
It made clear that relatively rapid and drastic climate change was now undeniable.
“Warming of the climate system is unequivocal, as is now evident from observations of increases in global average air and ocean temperatures, widespread melting of snow and ice, and rising global mean sea level.”
“Eleven of the last twelve years (1995-2006) rank among the 12 warmest years in the instrumental record of global surface temperature (since 1850).” (Page 5)
The report also noted the observed increases in the frequency and intensity of extreme weather events in the last few decades.
“At continental, regional, and ocean basin scales, numerous long-term changes in climate have been observed. These include changes in Arctic temperatures and ice, widespread changes in precipitation amounts, ocean salinity, wind patterns and aspects of extreme weather including droughts, heavy precipitation, heat waves and the intensity of tropical cyclones.” (Page 7)
It confirmed the link between the principal industrially generated greenhouse gases; carbon dioxide, methane and nitrous oxide, and rising mean temperatures.
“Most of the observed increase in globally averaged temperatures since the mid-20th century is very likely due to the observed increase in anthropogenic greenhouse gas concentrations.” (Page 10)
(Very likely in this context means with a probability of more than 90 %.)
The observed warming is currently at a rate of 0.74 deg C for 1906-2005, but 1.3 deg C per century averaged over the last 50 years (Page 5), and 2 deg C per century averaged over the last 15 years (Page 12), thus the warming is accelerating.
(The current EU policy is to try to hold down the global mean temperature rise this century to about 2 deg C.)
The report presented the extensive work on Climate Model Projections of warming trends, sea level rises and precipitation patterns for a range of scenarios. (Pages 12-16)
The projections of numerical models depend on the assumptions that are made about physical factors that may still at the moment be uncertain and the response of the world’s governments to the current situation.
These are not wildly speculative models, but are based on realistic alternative scenarios.
The best estimate predicted average temperature increases ranged up to about 4 deg C with sea level rises up to about 60 cm by the end of this century. (Page 13)
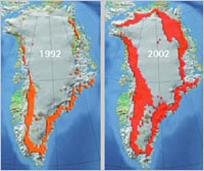
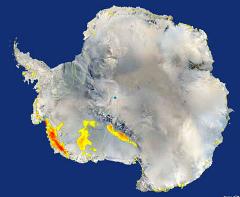
The projected sea level rise has been criticised for being too low, as the models do not include the possible increased rate at which ice may flow from the Greenland, and especially, the Antarctic ice sheets. For example, assuming a linear relationship between the ice flow rate and global mean temperature rise could add a further 20 cm to sea level rise. (Page 14)
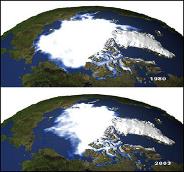
Arctic temperatures are currently increasing at about twice the global average rate. (Page 7) This may not seem very much, but think on this quote;
“The last time polar regions were significantly warmer than present for an extended period (about 125,000 years ago), reductions in polar ice volume led to 4 to 6m of sea level rise.” (Page 9)
It would take centuries for this much reduction in ice volume, but in a heavily populated world this would still mean ultimately displacing about 400 million people.
Feedback effects, including increasing atmospheric water vapour content, have been included, however the report admitted that uncertainties in positive feedbacks, referred to as climate-carbon cycle coupling, had not been included in the models for want of published data.
Stronger positive feedbacks would require more severe reductions in emissions, in order to ultimately stabilise atmospheric carbon dioxide at any given level. (Page 16)
Recent work however, has supplied more information in this area, for example a study showing the reduced effectiveness of the Southern Ocean to absorb carbon dioxide.
Perhaps even more significant is the possible positive feedback resulting from the warming of the Arctic lands.
The release of methane from the thawing Arctic tundra, archaic, trapped in ice, and newly formed, by the action anaerobic bacteria, has also been proposed as a likely positive feedback mechanism that has not yet been fully included in climate models.
Lord Rees, President of the Royal Society, responded to the publication of WGI thus:
“This report makes it clear, more convincingly than ever before, that human actions are writ large on the changes (that) we are seeing, and will see, to our climate.
The IPCC strongly emphasises that substantial climate change is inevitable, and we will have to adapt to this.
This should compel all of us -world leaders, businesses and individuals- towards action rather than the paralysis of fear.
We need both to reduce our emissions of greenhouse gases and to prepare for the impacts of climate change.
Those who would claim otherwise can no longer use science as a basis for their argument.”
The Report of Working Group II
Impacts, Adaptation and Vulnerability-Summary for Policymakers, was released on 6th April 2007 in Brussels.
This report considered in detail the observed impacts of climate change on the natural and human environment from 1970-2004.
It noted that natural variability was very unlikely to be the cause of the vast majority (90-100%) of significant changes that are consistent with warming. (Page 3)
This can be seen, region by region, on page 4.
It detailed the impacts of future warming; on water and food security, human health, and natural systems, projected by increasingly sophisticated and tested models. (Page 13)
It also considered the impacts due to altered frequencies and intensities of extreme weather events. (Page 14)
Some political delegations from the most polluting countries attempted to weaken the wording. For example, the last paragraph on page 17 was censored.
However, on page 19 a paragraph with almost identical meaning was allowed to remain. (Yossarian lives!)
“Unmitigated climate change would, in the long term, be likely to exceed the capacity of natural, managed and human systems to adapt.”
In other words, it concluded that both adaptation and mitigation measures were required to reduce the risks and that adaptation alone would not be sufficient.
Introducing the report Dr. Rajendra Pachauri, IPCC chairman, said;
“This report clearly assesses the impacts of climate change in different parts of the world, and we have far greater regional detail than in 2001 on things like glacier melting, and what the implications of that melting will be; on sea level rise, which clearly threatens a number of countries in the world, including mega-deltas which are particularly vulnerable; and on agriculture, which has implications for food security.” (See section C pages 6-12.)
He further added;
“It’s the poorest of the poor in the world, and this includes poor people even in prosperous societies, who are going to be worst hit.”
The report of Working Group III
Mitigation of Climate Change-Summary for Policymakers, was released on 4th May 2007 in Bangkok.
This report detailed the ways that we may stabilise and ultimately reduce the level of greenhouse gas (GHG) emissions.
It stressed the absolute urgency of the situation, that we have only about two decades to implement effective world-wide mitigation measures. (Page22)
To limit the long term global warming to about 2.5 deg C above the pre-industrial level, it showed that GHG emissions would need to peak in about 2020 and be reduced by 30-60% of their year 2000 level by 2050.(CategoryAB; Page 23)
(Given that it would be almost impossible to stay within the Category AA scenarios, then AB is optimistic, even with our best efforts, and a Category B scenario is more likely.)
It listed the key mitigation technologies commercially available now and projected in the medium and long term. These cover almost every sector of human economic activity from heavy industry to forestry. (Page 14)
It showed Energy supply, Buildings and Agriculture as having the largest emission reduction potentials. (Page15)
It included passive and active solar design for heating and cooling, and increased use of renewable energy generally, as key mitigation technologies in the buildings sector. (Page 14)
It stated the importance of energy efficiency options for new and existing buildings.
“By 2030, about 30% of projected GHG emissions in the building sector can be avoided with net economic benefit.” (Page 19)
The report was optimistic about the opportunities for international cooperation.
“The literature identifies many options for achieving reductions of global GHG emissions at the international level through cooperation. …..” (Page33)
It concluded by stressing the links between sustainable development paths and climate change mitigation and noted the additional benefits of renewable energy. (Page 34)
However, at the release of the report, WGIII co-chair, Ogunlade Davidson, gave a stark warning when he said;
“If we continue to do what we are doing now, we are in deep trouble.”